Within the general statistics for emails, you can find a complete and accurate summary of your data from the first delivery to the last. These general numbers show the results in real time of the behavior of your all your campaigns. Taking a look at the most recent issues of your email campaigns, will easily allow you to study and fully understand the behavior of your past and current email marketing campaigns.
The precise measurement of our campaigns, allows you to see and calculate the results that will reveal where you have failed and how you can improve the shipments you will make.
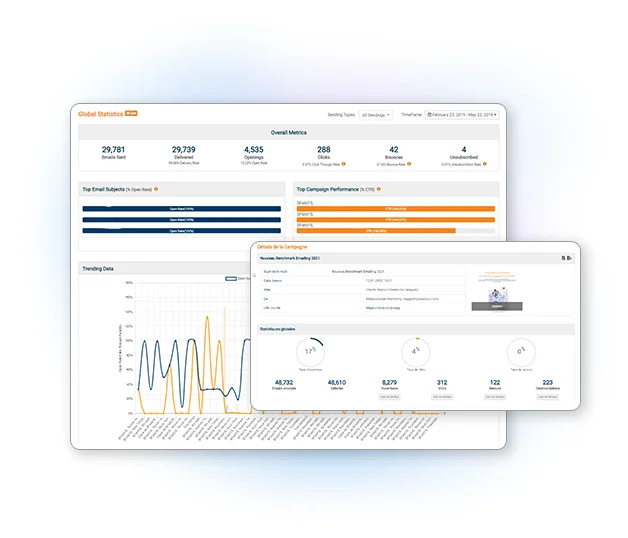
Take the analysis of the days when your emails are open, and observe in chronological order the detail of your campaigns with graphs that summarize the percentages of:
- Email delivery rate: with the number of emails sent and delivered to your subscribers as well as the amount of Badmail, messages that did not reach their destination.
- Reactivity of your email campaigns: where you will find the opening rate, number of clicks and percentage of emails recipients that have canceled their subscription.
To have more a detailed statistics visualization, check our plans and prices.
See all data from the dates your first campaign was created to the most recent, using the time period box, located on the upper right corner of your statistics screen. Among the predefined options you will find, you can view your statistics at the current time per week, the last 14 days, current and past month. As well as "all time", which will show you all your campaigns from the first shipment made to the last.
If you made a campaign during special dates such as Christmas, New Year’s or any other, and want to specifically verify the data during those days, you can do so using the custom time range, setting the start and end date you prefer.
Having deep knowledge of the statistics of your Email Marketing campaigns will allow you to determine the effectiveness of your campaigns and optimize them when necessary. Applying resources where you can compare current data with the past ones will allow you to compare campaigns and know which subscribers you should reach to get them to know about your products or services.
To study each campaign in more detail, you can refer to the Campaigns tab which will show you specifically all the basic statistics that will allow you to know the quality of your campaigns. There, you can geolocate your subscribers, find out which operating system your reader uses, as well as whether your email campaigns are opened with more frequency on mobile devices or PCs. Having this data individually will help you adapt the design and content of your message and thus increase the effectiveness of your email marketing campaign.
Don’t skim over any of the newsletter metrics, try all the options that Mailpro has to offer, and fully analyze the statistics of your email campaigns.
Email Marketing Software
& Email Automation
Open a Mailpro account and enjoy 500 free credits
Try for free
This site uses Cookies, by continuing your navigation, you accept the deposit of third-party cookies intended to offer you videos,
sharing buttons, but also understand and save your preferences. Understand how we use cookies and why: More information